Diagnostic tests
Resources for teaching LR etc
Forest plots, funnel plots – and what’s with the mysterious diamond symbol, lurking like a secret sign, in meta-analyses? Meta-analysis is a statistical technique for combining the results of studies. It is often used in systematic reviews (and in non-systematic reviews, too).
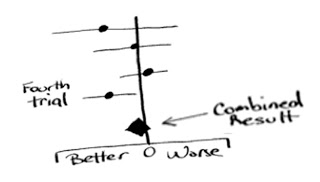
A forest plot is a graphical way of presenting the results of each individual study and the combined result. The diamond is one way of showing that combined result. Here’s a representation of a forest plot, with 4 trials (a line for each). The 4th trial finds the treatment better than what it’s compared to: the other 3 had equivocal results because they’re crossing the vertical line of no effect.
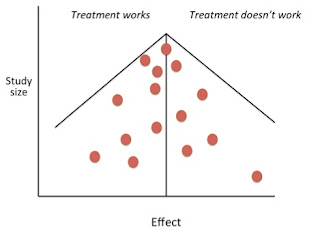
A funnel plot is one way of exploring for publication bias: whether or not there may be unpublished studies. Funnel plots can look kind of like the sketches below. The first shows a pretty normal distribution of studies – each blob is a study. It’s roughly symmetrical: small under-powered studies spread around, with both positive and negative results.
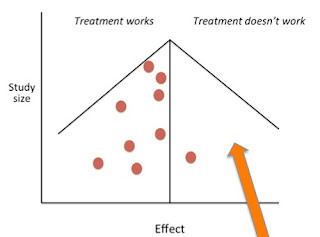
This second one is asymmetrical or lopsided, suggesting there might be some studies that didn’t show the treatment works – but they weren’t published:
Text reproduced from http://statistically-funny.blogspot.co.uk/. Cartoons are available for use, with credit to Hilda Bastian.

Discussion
0 Comments